Know what needs attention
Dashboards help support leaders see where queues are building up and which desks need intervention.
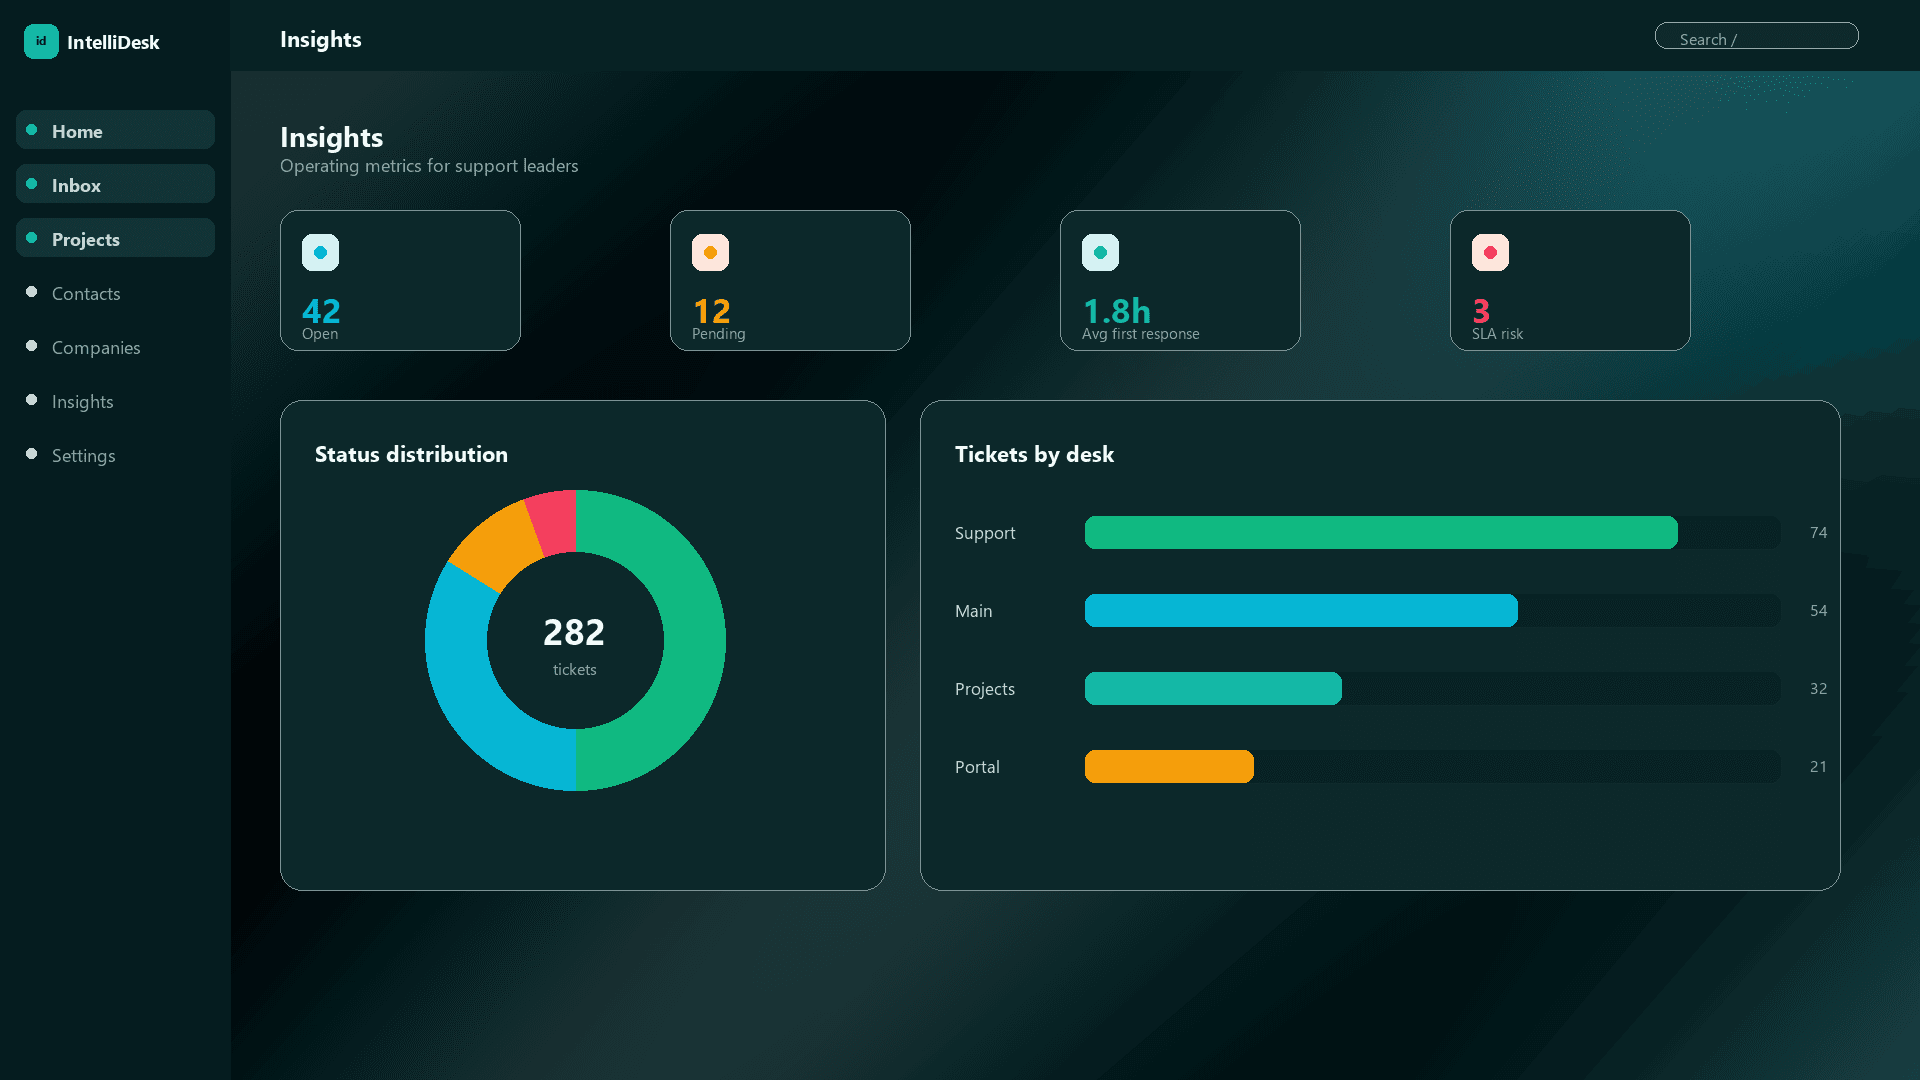
Support analytics
Track open work, pending tickets, response times, SLA risk, desk performance, and workload from one operating view.
Dashboards help support leaders see where queues are building up and which desks need intervention.
Track response time, closure trends, SLA risk, ticket volume, and workload signals in the same workspace agents use every day.
Because reporting is connected to tickets, desks, and projects, managers spend less time reconciling spreadsheets.
More IntelliDesk paths
Capture requests from email, route them to the right team, track status, and keep every customer conversation connected to the work behind it.
Learn moreBring Gmail, Outlook, and IMAP conversations into one workspace where every request has a status, owner, priority, and activity trail.
Learn moreUse kanban boards, stages, assignments, checklists, and notes to turn support requests into visible delivery work.
Learn more